Main Chart Integration: The Volume Stats widget is globally synced to your main chart. It automatically tracks the volume of whichever symbol is currently active in your primary workspace. Currently, only one Volume Stats widget can be added at a time.
Market Activity & Intervals
The widget tracks total trading activity across a rolling 24-hour window, presented in 30-minute intervals. This granularity allows you to spot specific times of day when trading volume is at its peak.- Dynamic Volume Display:
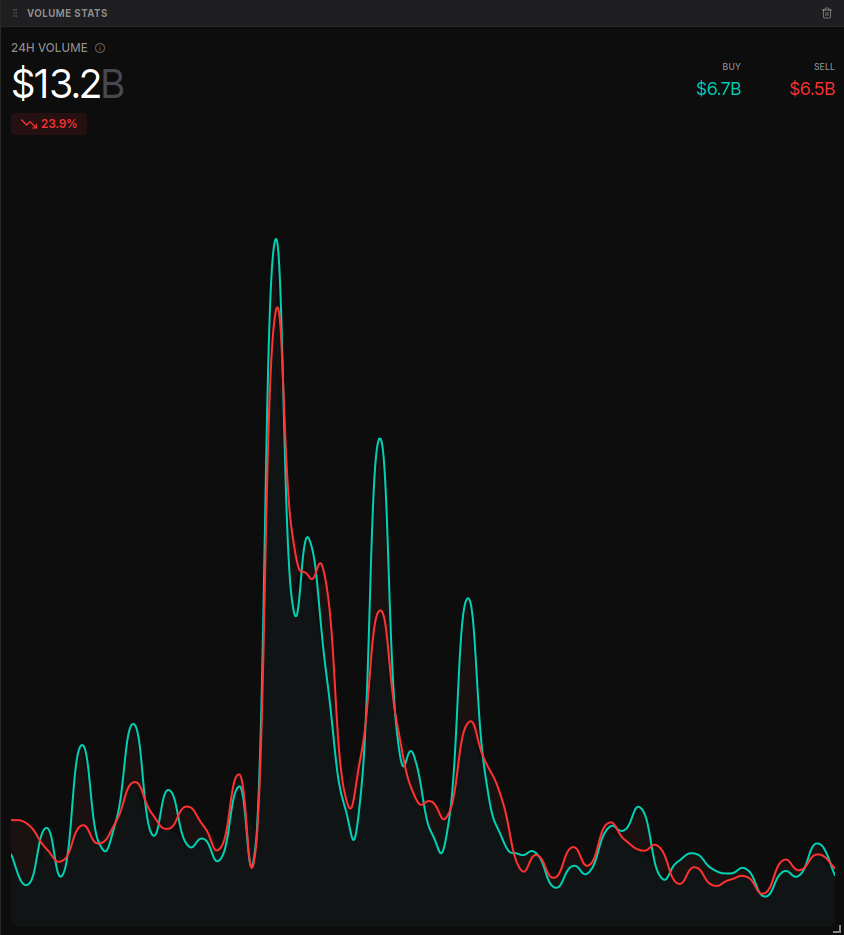
- Default View: When not mousing over the chart, the widget displays the Total Trading Volume for the last 24 hours (e.g., $15.2B).
- Interval Hover: Mouse over any specific point on the timeline to see the exact volume executed during that 30-minute interval.
- Percentage Changes: The widget automatically calculates and displays the percentage change in volume. In the hover state, this shows the change from the previous interval to the current one, helping you identify sudden surges in market participation.
Buy vs. Sell Analysis
To provide deeper insight into market sentiment, volume is categorized based on the side of the aggressive taker:- Buy Volume (Green): Volume generated by aggressive market buy orders hitting the ask.
- Sell Volume (Red): Volume generated by aggressive market sell orders hitting the bid.
- Real-time Breakdown: The top right of the widget provides the specific dollar-value split between BUY and SELL volume for the selected period.
Interactive Visualization
The line chart features overlapping green and red waves to help you visualize the “tug-of-war” between buyers and sellers.- Time-Series Tracking: View the precise timestamp for any data point by hovering over the chart (e.g., “Jan 5, 08:00”).
- Trend Identification: Use the peaks and troughs of the red/green lines to identify periods where one side of the market is significantly more aggressive than the other.