Main Chart Integration: The Market Stats widget is globally synced to your main chart. It automatically tracks the metrics of whichever symbol and exchange is currently active in your primary workspace.
Widget Layout
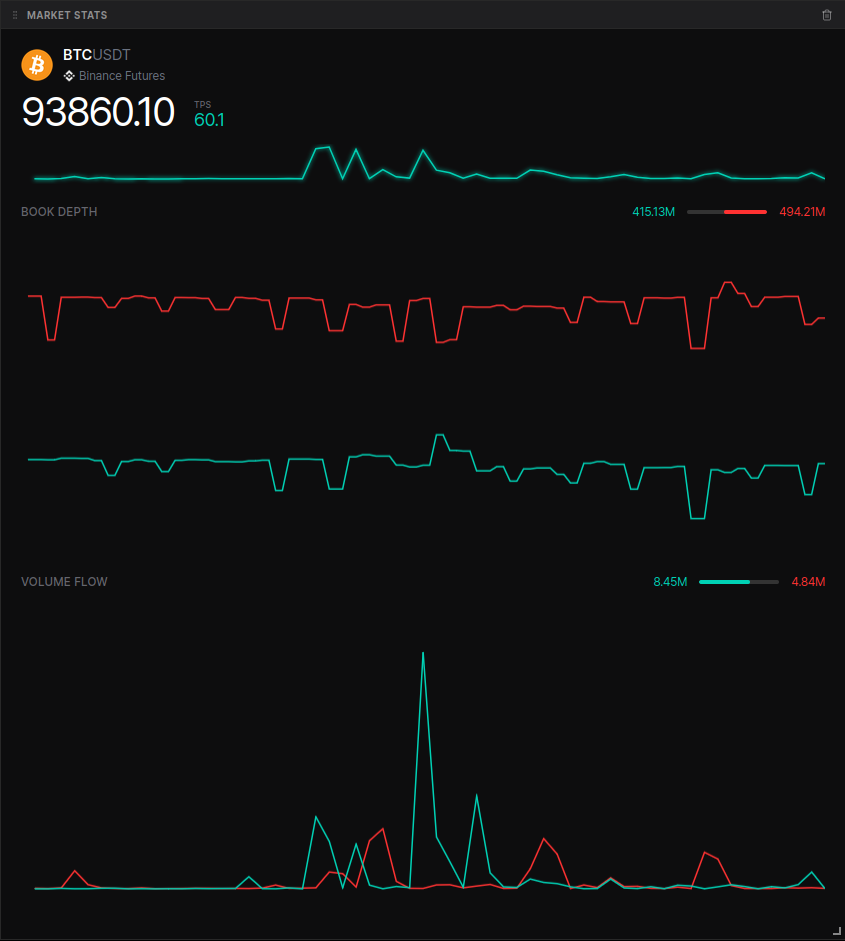
The widget is divided into three primary real-time monitoring sections, each featuring numerical values, historical sparkline charts, and interactive hover states.1. Header & Execution Activity
The top section displays the essential identity of the asset and its current execution speed.- Symbol Info: Displays the coin icon, the symbol name (e.g., BTCUSDT), and the source exchange (e.g., Binance Futures).
- Price: Large, real-time display of the last traded price in USD.
- TPS (Trades Per Second): A bullish/green metric indicating the frequency of trade executions.
- TPS Sparkline: A real-time chart showing the history of trade frequency. Hover over the chart to see the exact TPS value at a specific timestamp.
2. Book Depth Section
This section monitors the “thickness” of the order book, showing the resting liquidity available near the current price.- Bid & Ask Values: Displays the total dollar amount of liquidity sitting on the bid (green) and ask (red) sides within a specific percentage of the mid-price.
- Depth Gauge: A visual imbalance bar that instantly shows the ratio of bid vs. ask dominance.
- Depth Sparkline: A dual-line chart tracking how the bids and asks are evolving over time.
3. Volume Flow Section
Volume flow tracks the actual dollar value of executed trades, distinguishing between aggressive market buys and sells.- Buy & Sell Values: Numerical display of the accumulated dollar volume for market-buy (green) and market-sell (red) orders.
- Flow Gauge: A visual indicator showing the ratio of executed buy volume versus sell volume.
- Flow Sparkline: A dual-line chart visualizing the “tug-of-war” between aggressive buyers and sellers.
Key Metric Definitions
| Metric | Type | Description |
|---|---|---|
| TPS | Execution | The number of trades executing per second. Higher TPS typically correlates with higher volatility. |
| Book Depth | Liquidity | The total value of passive limit orders. Shows how much volume can be absorbed before the price moves significantly. |
| Volume Flow | Volume | The total USD value of trades executed. Measures the actual “heavy lifting” being done by market participants. |