Main Chart Integration: The Liquidity Stats widget is globally synced to your main chart. It automatically tracks the depth of whichever symbol is currently active in your primary workspace. Currently, only one Liquidity Stats widget can be added at a time.
Market Depth & Intervals
The widget visualizes the “thickness” of the order book across a rolling 24-hour window, presented in 30-minute intervals. By focusing on the 2.5% range, it filters out deep, non-actionable liquidity to show you the true state of the near-market depth.- Dynamic Depth Display:
- Default View: When not mousing over the chart, the widget displays the Current Book Liquidity.
- Interval Hover: Mouse over any specific point on the timeline to see the Total Book Liquidity that was available during that specific 30-minute interval.
- Percentage Changes: The widget automatically calculates and displays the percentage change in liquidity. In the hover state, this shows the change from the previous interval to the current one, allowing you to detect when market makers are adding or pulling significant liquidity from the book.
Bid vs. Ask Breakdown
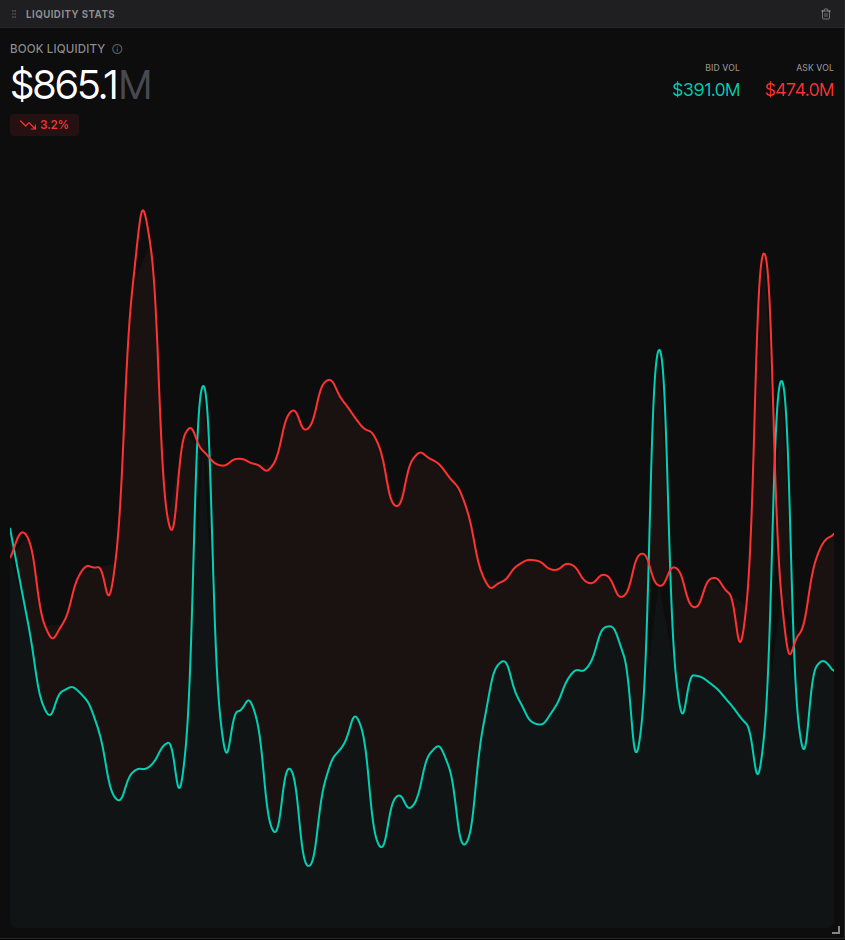
The widget provides a clear distinction between the two sides of the order book to help you identify liquidity imbalances:- Bid Vol (Green): The total volume of limit buy orders within 2.5% of the top of the book.
- Ask Vol (Red): The total volume of limit sell orders within 2.5% of the top of the book.
- Real-time Stats: The top right of the widget provides the exact dollar-value breakdown for both BID VOL and ASK VOL for the currently selected interval.
Interactive Visualization
The chart uses a dual-line time series to show how the bids and asks evolve over time.- Imbalance Identification: Use the gap between the red and green lines to identify which side of the book is more heavily defended. A rising Bid Vol alongside a falling Ask Vol often suggests a bullish liquidity shift.
- Timestamp Tracking: Hovering over the lines reveals the precise time (e.g., “Jan 5, 08:00”) for each data point, making it easy to correlate liquidity drops with major news events or price moves.