Single Asset View: Each Order Book DOM widget is designed to monitor a single coin at a time. To track multiple assets simultaneously, you can add multiple Order Book widgets to your workspace layout.
Core Functionality
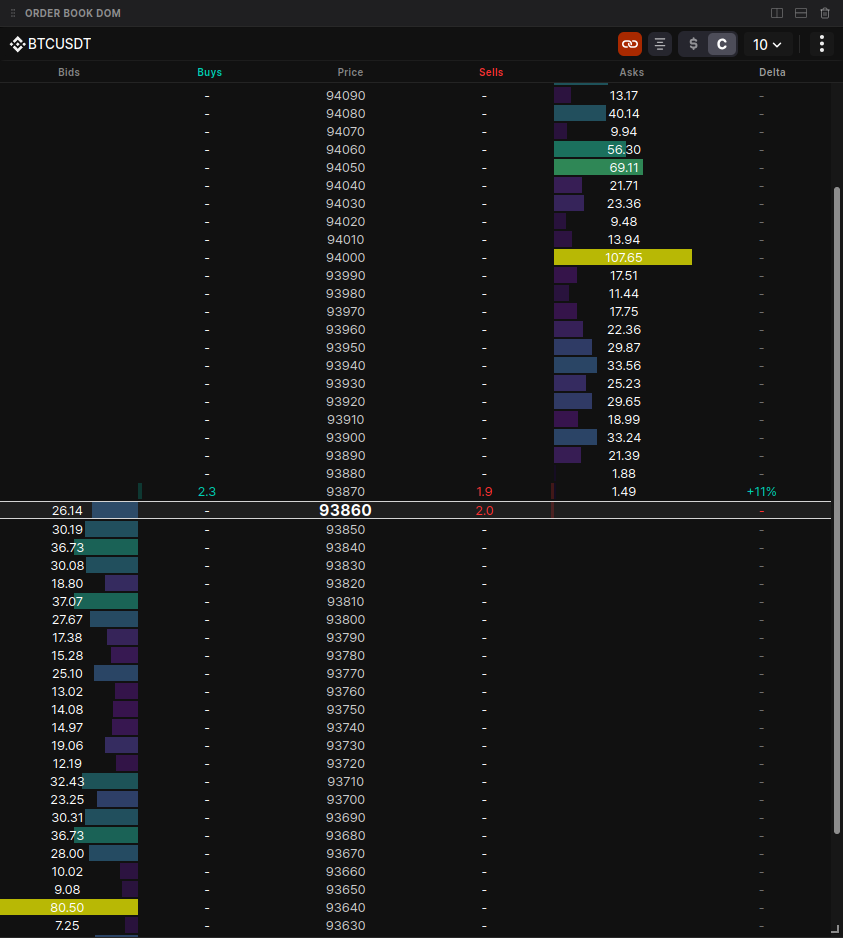
Navigate market depth with precision using professional-grade controls.- Symbol Management:
- Switch Symbols: Click the symbol name to manually search and switch to a different asset.
- Multi-Symbol Navigation: While each widget displays one coin, the search interface allows you to quickly pivot between up to 5 recently selected symbols.
- Sync State: Toggle the Link icon to sync the DOM with your main chart. When enabled, switching your chart’s asset will instantly update the DOM widget to match.
- Depth Exploration:
- Deep Inspection: Scroll up or down to view bid and ask levels far from the current market price.
- Center View: Use the Center button to instantly snap the view back to the mid-price row, which highlights the current best bid price.
Column Breakdown
The DOM is organized into 6 specialized columns to provide total transparency into the auction process:| Column | Name | Description |
|---|---|---|
| 1 | Bids | Shows limit order sizes for buy orders. Uses a color-coded heatmap where bar intensity reflects size relative to the maximum depth. |
| 2 | Buys | Cumulative counter of market buy trades (aggressive takers). Features a green background bar (20% opacity) extending left-to-right. |
| 3 | Price | The central axis. Decimal precision automatically adjusts based on your selected block size/grouping. |
| 4 | Sells | Cumulative counter of market sell trades. Features a red background bar (20% opacity) extending right-to-left. |
| 5 | Asks | Shows limit order sizes for sell orders. Like the Bids column, it uses heatmap intensity to visualize liquidity depth. |
| 6 | Delta | The net difference between buy and sell volumes shown as a percentage: (Buys - Sells) / (Buys + Sells) * 100%. |
Data & Display Customization
Units & Grouping
- Unit Toggling: Switch between Base Units (e.g., BTC) or Total Dollar Value (USD) to analyze liquidity in your preferred context.
- Dynamic Price Grouping: Adjust price precision to compress the book. Available grouping increments are dynamic and depend on the specific coin’s price.
Themes & Sensitivity
- Themes: Choose from visual presets (e.g., Sunset, Ocean) to customize the color-coding of the heatmap and trade flow.
- Sensitivity: Adjust the sensitivity slider to change the intensity of the heatmap highlights, making significant “liquidity walls” stand out more clearly.