
Visualizing Market Stress
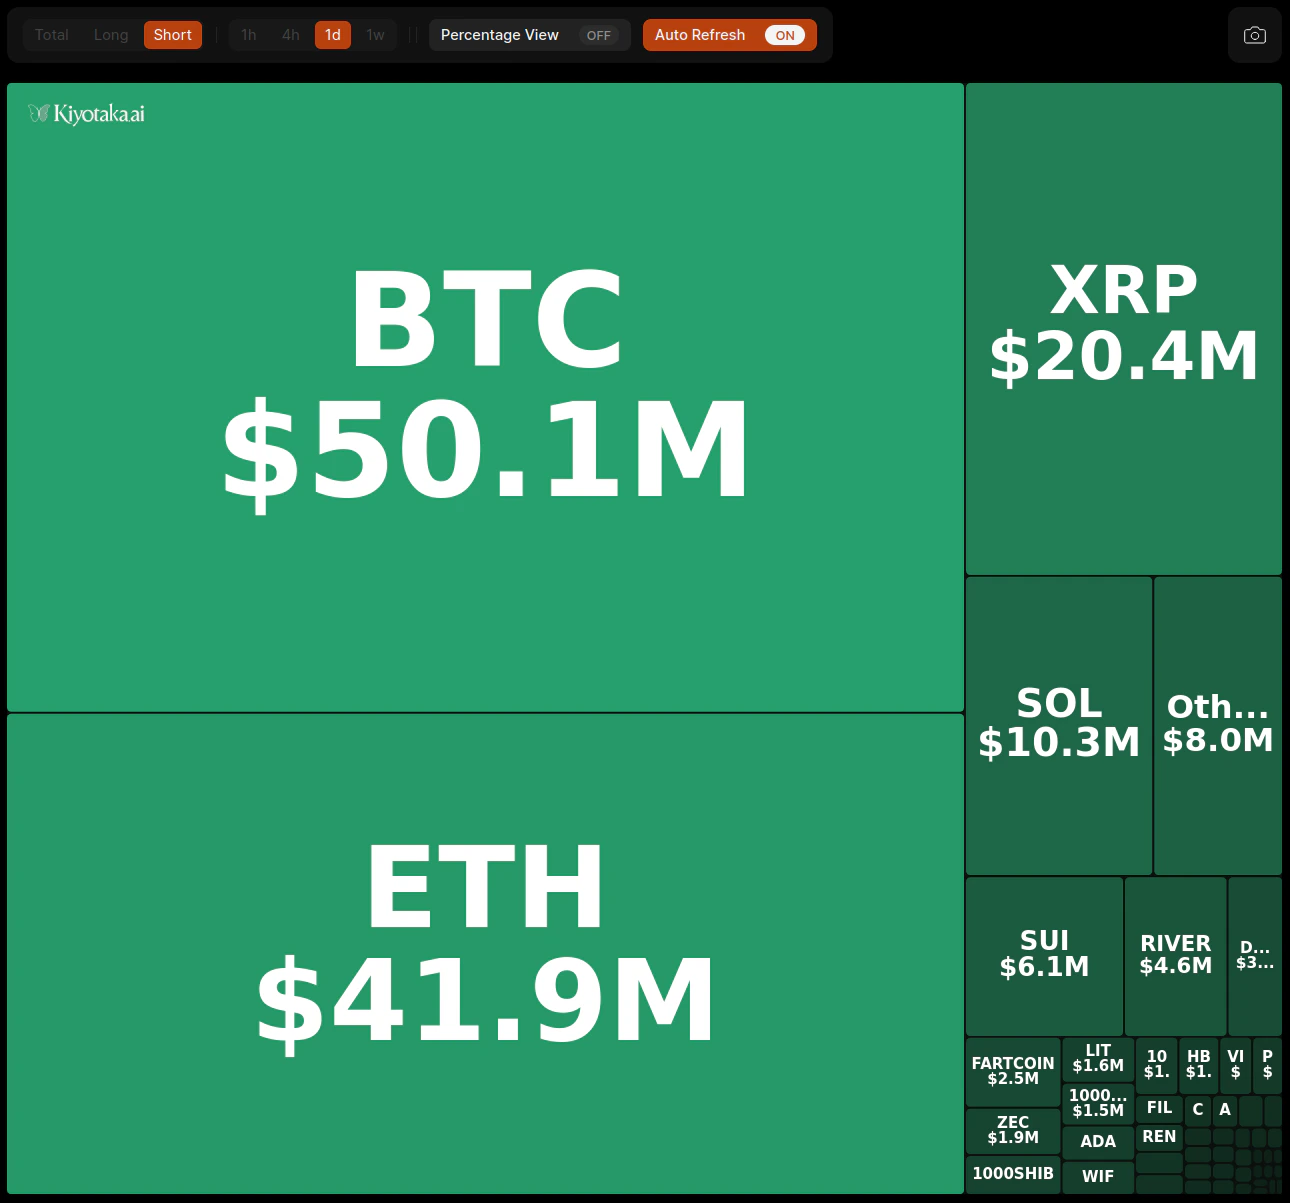
The primary visualization for market-wide liquidations is the Treemap (Tiles) View, which offers a compact way to monitor hundreds of symbols simultaneously.Treemap Mechanics
- Tile Size: The size of each asset’s tile is proportional to its total liquidation volume relative to the rest of the market.
- Asset Identification: Each tile displays the symbol (e.g., BTC, PEPE) and the corresponding dollar value of liquidations for the selected period.
- Hierarchical View: Smaller tiles are grouped under an “Others” category to maintain clarity for high-volume assets.
Filters & Configuration
Customize the data feed to isolate specific market regimes or timeframes using the control header.Data Toggles
- Side Selection: Filter between Total, Long, or Short liquidations to determine if the market pressure is coming from buyers or sellers being squeezed.
- Timeframe: Adjust the lookback period to 1h, 4h, 1d, or 1w to capture short-term spikes or long-term trends.
Display Settings
- Percentage View: Toggle this on to view an asset’s liquidation volume as a percentage of the total market liquidations currently displayed in the treemap, rather than an absolute dollar value.
- Auto Refresh: Enable this feature to keep the data updating in real-time without needing a manual page reload.
- Snapshot: Use the camera icon in the top right to capture the current state of the market liquidations for sharing.