Key Features
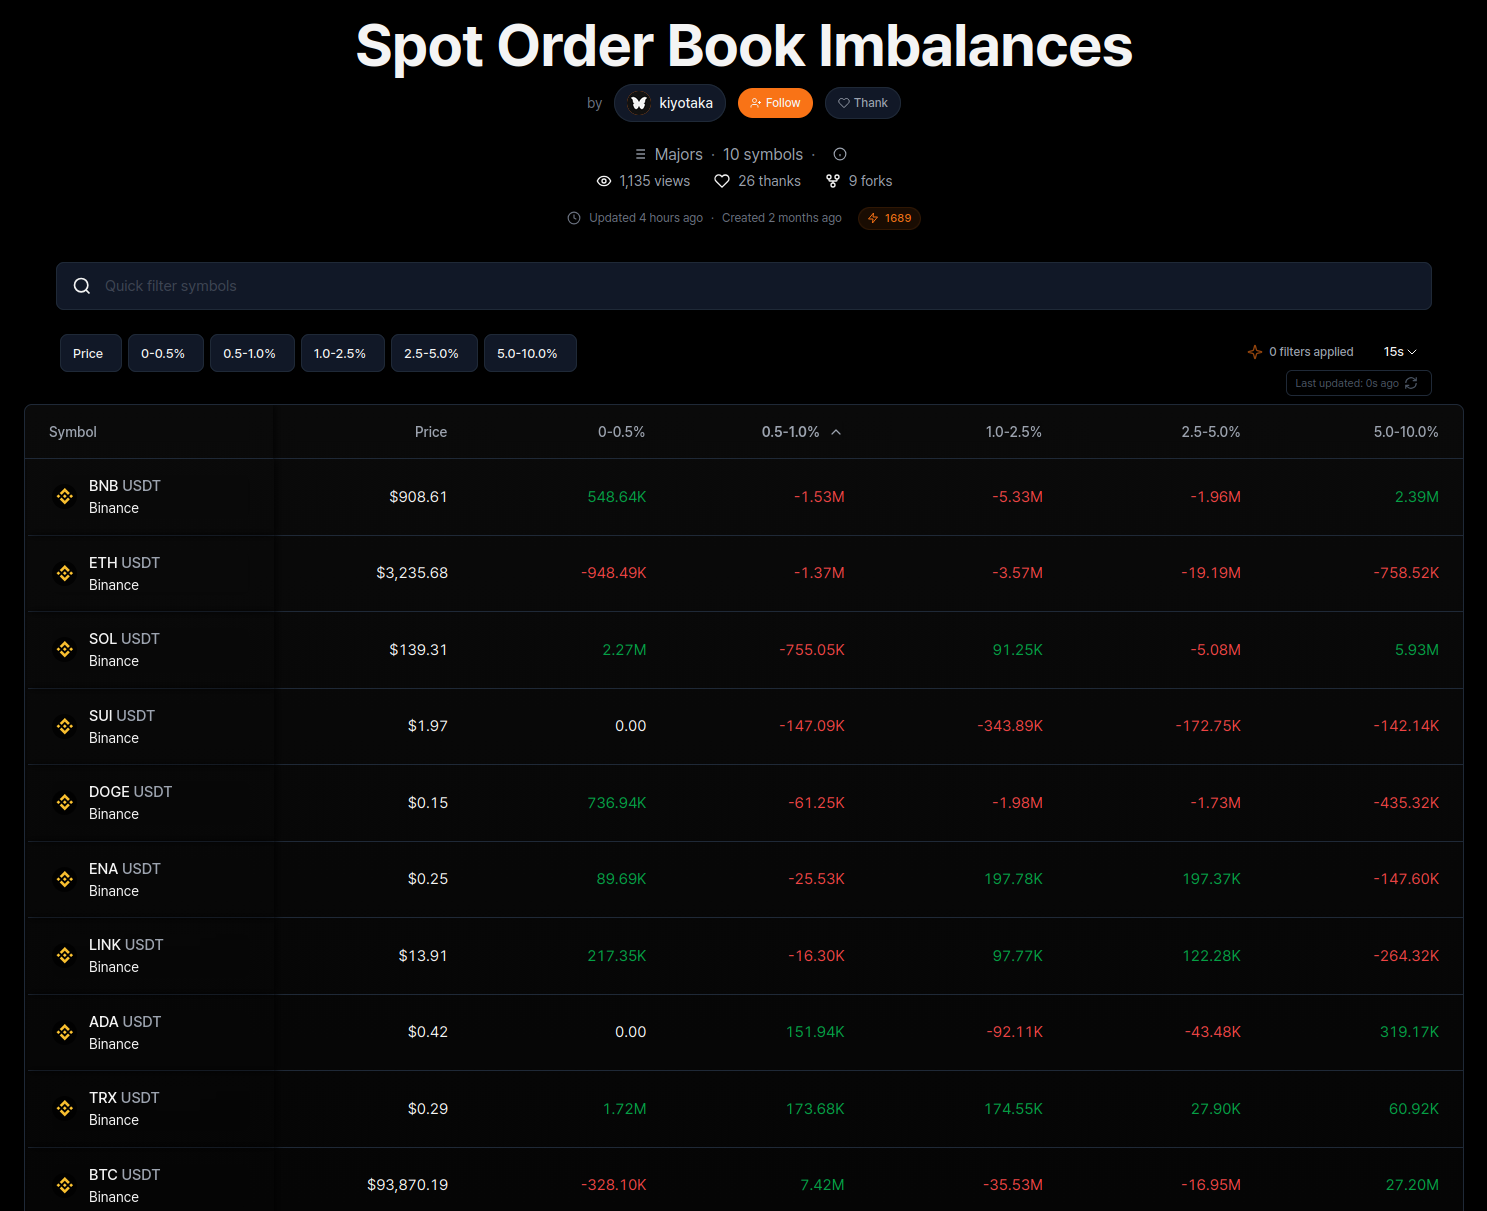
Market-Wide Scanning
Monitor price action and order flow across thousands of symbols simultaneously.
Custom Indicators
Add any official indicator or your own custom kScripts as data columns.
Advanced Filtering
Narrow your focus using multi-condition filters to find specific market anomalies.
Modular Visualizations
Toggle between List, Tiles, Strips, and Scatter plot views to visualize data trends.
The Screener Hub
The Screener Hub is a central marketplace for discovering, publishing, and forking battle-tested strategies.- Featured & Popular: Access curated lists of the most effective community screeners.
- Forking: Every open-source screener is forkable, allowing you to copy a template and further customize its logic.
- Publishing: Once your screener is configured, you can publish it to the hub to collect views, likes, and forks.
Creating a Screener
To build a new scanner, click the + New Screener button to open the configuration dialog.Watchlists
Watchlists are sets of symbols that define the scope of your scan. You can choose from a variety of predefined categories or use your own custom-built lists.- Predefined Lists: Quickly scan sectors like Majors, Layer 1s, or Memes.
- Custom Watchlists: Users can create their own personalized watchlists to track specific assets. For detailed instructions on managing your own lists, refer to the Terminal Watchlist Documentation.
Metadata & Categories
- Categorization: Assign your screener to categories like Order Flow, Liquidity, or Narrative.
- Tags: Add searchable keywords to improve discoverability on the Hub.
- Preserve Settings: Enable this to keep your current column and filter configurations when saving a template.
Visualization Modes
Customize how you digest market data using specialized view modes:- List View: A standard tabular layout for comparing metrics across symbols.
- Tiles View: A treemap-style visualization where tile size and color reflect market momentum or specific indicator values.
- Strips View: A streamlined horizontal view focused on price and key values.
- Scatter Plot: Visualize asset distribution across two custom axes (e.g., Price vs. Volume Delta).
Tier Benefits & Limits
Access to kScreener performance is determined by your user tier, which can be upgraded via the referral system.| Tier | Referrals Required | Assets | Indicators | Columns | Update Frequency |
|---|---|---|---|---|---|
| 1 | 0 | 10 | 4 | 5 | 15s |
| 2 | 10 | 15 | 5 | 6 | 10s |
| 3 | 25 | 20 | 7 | 8 | 5s |
| 4 | 50 | 25 | 8 | 9 | 5s |
| 5 | 100 | 50 | 10 | 11 | Live |
Tier 5 users enjoy Live update frequencies, providing the most competitive edge for real-time analysis.